HPLC Testing Explained: How Peptide Purity Is Actually Measured
High-performance liquid chromatography (HPLC) is the primary analytical method used to assess the purity of synthetic research peptides. Understanding what an HPLC report actually measures and what it does not—helps researchers interpret Certificates of Analysis accurately.
How HPLC Works for Peptides
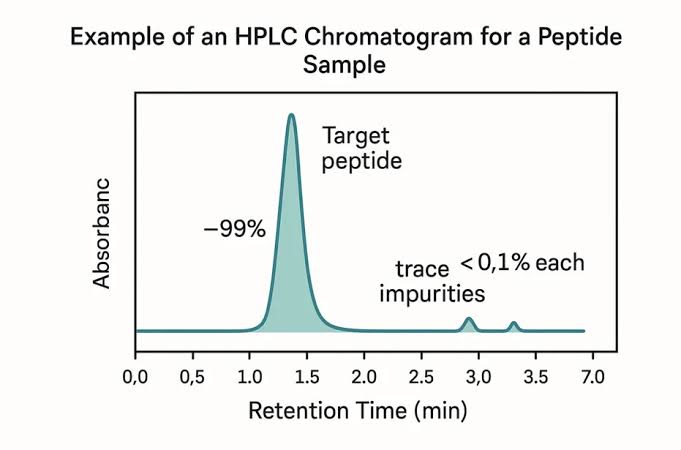
A dissolved peptide sample is injected into a high-pressure liquid stream and forced through a chromatographic column, typically a reverse-phase C18 stationary phase. Different molecules interact with the column material to different degrees and therefore exit (elute) at different times. A detector, usually ultraviolet absorbance at a wavelength appropriate for peptide bonds or aromatic residues, records the signal as a chromatogram a graph of detector response versus time.
The main peak corresponds to the target peptide. The area under that peak relative to the total area of all detected peaks is reported as the purity percentage. A result of 98.7 %, for example, indicates that 98.7 % of the UV-absorbing material in the sample is the intended peptide sequence (or closely related species that co-elute).
What HPLC Purity Numbers Mean
Common research thresholds:
- ≥95 % – often acceptable for preliminary screening or non-quantitative work
- ≥98 % – preferred for most quantitative or dose-sensitive experiments
- ≥99 % – higher-stringency applications
These percentages refer only to organic species that absorb at the detection wavelength. They do not automatically account for residual solvents, inorganic salts, water content, or biological contaminants.
Complementary Techniques
Mass spectrometry (MS) is frequently paired with HPLC. MS confirms that the molecular weight of the main peak matches the calculated mass of the target sequence, providing identity verification. Without MS or equivalent identity data, an HPLC purity figure alone cannot confirm that the main peak is the correct peptide.
Other tests sometimes included on comprehensive COAs include residual solvent analysis, water content (Karl Fischer), endotoxin levels, and microbial limits. These address impurities HPLC cannot detect.
Reading a Real Chromatogram
A credible HPLC report typically includes:
- The chromatogram itself (not merely a stated percentage)
- Retention time of the main peak
- Integration of all significant peaks
- Method parameters (column type, gradient, wavelength, flow rate)
- Batch or lot number matching the material
Red flags include missing chromatograms, suspiciously identical purity values across unrelated batches, mismatched lot numbers, or pure numerical claims without supporting data.
Limitations of HPLC Alone
HPLC purity is necessary but not sufficient. A peptide can score ≥99 % by HPLC and still contain residual trifluoroacetic acid (TFA) from synthesis, residual solvents, or salts that affect solubility or biological assays. Researchers working with cell culture or in vivo models often request additional testing for these parameters.
Practical Use for Buyers and Researchers
When evaluating supplier documentation:
- Confirm the COA is batch-specific.
- Verify that both HPLC purity and identity (MS or equivalent) are present.
- Check that the reported method is appropriate for peptides.
- Prefer independent third-party testing when available.
- Cross-reference the lot number on the vial with the COA.
Nexus Peptides Lab provides batch-linked documentation so researchers can perform exactly this verification.
HPLC remains the industry standard for peptide purity assessment because it is quantitative, reproducible, and widely accepted. Interpreting the data correctly, rather than treating a single percentage as a complete quality guarantee, is the difference between informed research material selection and reliance on marketing numbers.